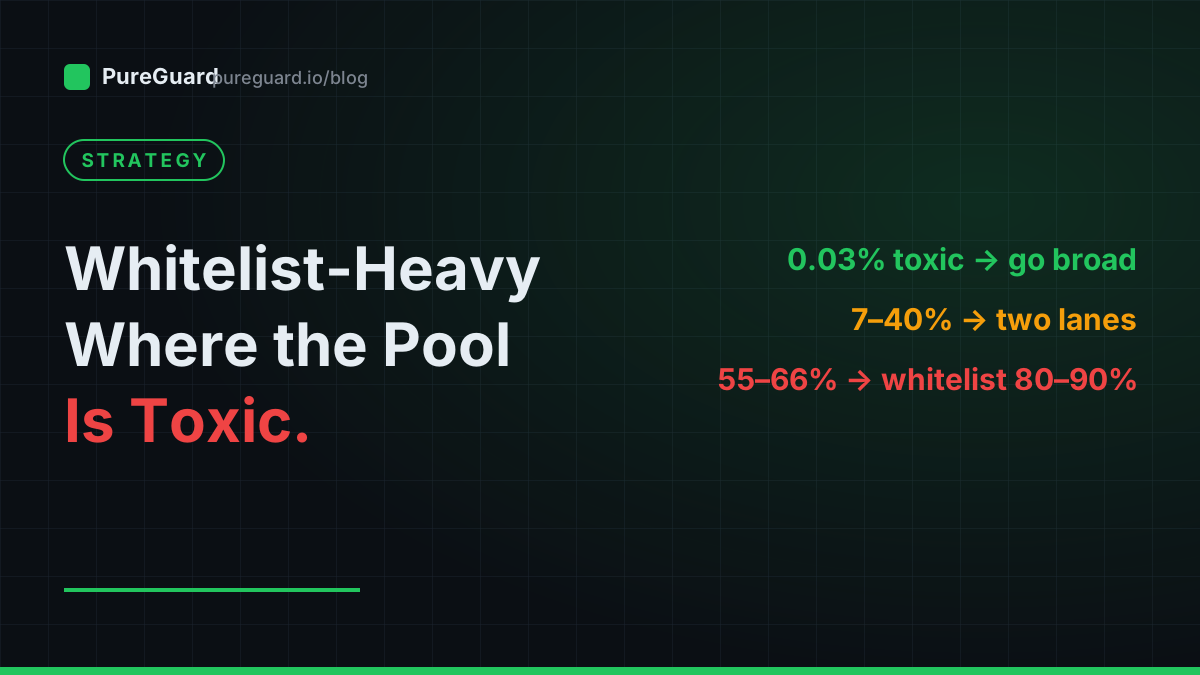
Every guide about pop traffic eventually tells you two things: “build a blocklist” and “whitelist your winners.” What almost none of them tell you is how much budget belongs in each — and that the right answer is not a fixed ratio. It is a dial, and the thing that sets the dial is a number most buyers never look up: what share of the network’s zone pool is toxic.
We can look it up, because our engine tracks 96,000+ zones across 60+ networks. Here is the rule, with the evidence behind it.
The rule
Whitelist-heavy where the pool is toxic. Broad where the pool is clean. Always keep a small, capped discovery lane.
Why toxicity decides it: the substitution problem
When you exclude a bad placement, the network does not send you less traffic — it substitutes another placement from its pool. Whether that substitute is clean is pure pool statistics:
- On a network where 0.03% of zones are bad, the substitute is almost certainly fine. Exclude-mode is cheap to run; a blocklist converges and stays converged.
- On a network where 6 in 10 zones are bad, the substitute is probably another bad zone — often the same operator under a fresh placement ID. We watched this live: one campaign group’s exclusion list grew from 140 placements to 296 in twenty-four hours while traffic quality improved — the signature of junk rotating, not of filtering failing. On that pool, a blocklist never converges. You are on a treadmill, and every rotation cycle bills you for the new placement’s detection window at full price.
An include-mode (whitelist) campaign breaks the loop structurally: a freshly minted junk placement is not on your list, so it never serves, never bills, never needs detecting. Rotation cannot touch it. That is not an opinion — it is how include-mode targeting works.
So why not 100% whitelist?
Because whitelists starve without discovery. A whitelist entry is a lease, not a marriage: zones die, sell their traffic on, change hands, degrade. We curate whitelists continuously for exactly this reason — and if you run zero broad traffic, you find zero new placements to graduate. Six months of whitelist-only and you are scaling a shrinking asset.
The fix is a discovery lane with a hard cap: a broad exclude-mode campaign at 10–20% of budget whose only job is auditioning new placements. Accept that it rides the treadmill; that is what it is for. Modern automated exclusion catches new junk within minutes-to-hours, so the audition fee stays small — but cap it anyway, because on toxic pools the treadmill never fully stops.
The dial, concretely
- Pool >40% toxic: whitelist carries 80–90% of budget. Discovery is a strictly capped audition, nothing more. Broad buying here is donating money at scale.
- Pool 10–40% toxic: a genuine two-lane split. Broad is workable with active automated exclusion; graduate proven placements and shift budget toward the whitelist as it matures.
- Pool <10% toxic: broad is your main lane — a whitelist-only rule here just caps your volume for protection you barely need. Use whitelists for bid-up on proven winners, not as a shield.
Where do real networks fall? In our current measurement: the cleanest pop network we track runs 0.03% blocked zones, the strongest mid-tier runs ~7% (and has the most provably-trusted zones of any network), and the bottom tier runs 55–66%. The full graded list is in the Traffic Source Report Card.
Graduation criteria: what earns a whitelist seat
Do not graduate on click volume. Graduate on proof, over enough sample to mean something:
- Sustained accept rate through bot filtering (not one good day);
- Real-device and real-browser evidence, not just clean IPs — residential proxies pass IP checks;
- Render or engagement proof where measurable — a zone whose visitors are never actually on-screen is buying you nothing (render rate is the KPI that predicts profit);
- Conversions or downstream engagement, when your funnel produces them.
And keep auditing after graduation. In our systems the whitelist itself is re-verified continuously and entries lose their seat when the evidence decays — because the zone you approved in June is not guaranteed to be the same zone in September.
FAQ
Should I run only whitelist campaigns on pop traffic?
Only on heavily toxic pools (40%+ bad zones) — and even there, keep a small capped discovery lane or your whitelist will decay with nothing to replace it. On clean networks, whitelist-only needlessly caps volume.
How big should the discovery budget be?
10–20% on toxic networks, with a hard daily cap. Its job is auditioning placements, not profit. On clean networks discovery and main lane can be the same broad campaign.
How do I know a network’s toxicity before spending?
Check zones before you buy: our free zone checker reports the verdict for any zone ID from live cross-network measurement, and the report card grades whole networks by blocked-zone share.